
XenServer metrics in real examples

After the first introduction of how we displayed XenServer metrics in Xen Orchestra, here is some real examples and why it's really important to have an eyes on this kind of information. That's one of the powerful feature of the virtualization: because everything goes through the hypervisor, you can measure everything coming from your VMs and detect, analyse and understand any workload. And finally, Xen Orchestra brings you that directly in your web browser!
Compiling a linux kernel in a Debian PVHVM
This load is very interesting. First, the image:
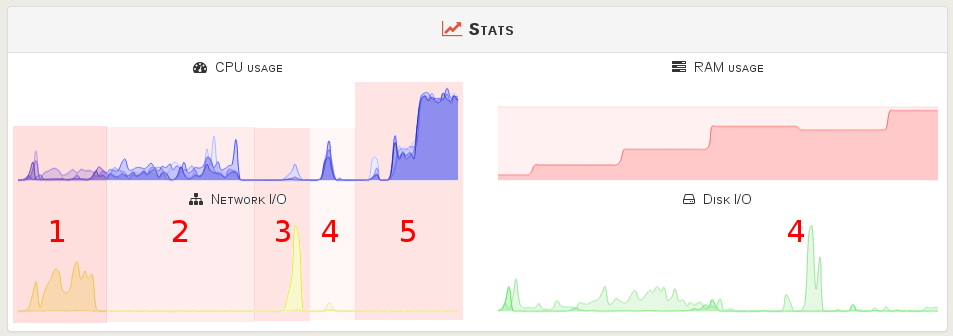
- I made a
apt-get update: network charts is pretty obvious (yellow) - This time,
apt-get dist-upgrade: more CPU usage (blue) and disk read (light green). Also note the RAM usage also increasing by steps (red) - I just downloaded the latest kernel with a
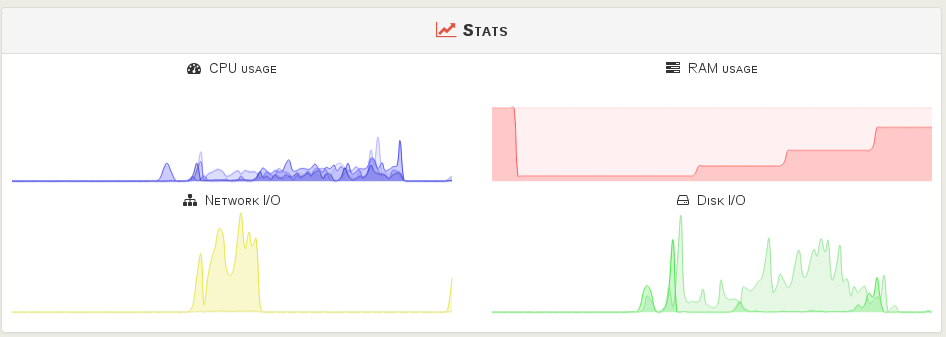
wget https://www.kernel.org/pub/linux/kernel/v4.x/linux-4.0.tar.xz, thus explains the spike in network usage (yellow) - Extracting the tarball displayed a increasing usage of CPU and disk read: it makes sense! FYI, the obvious:
tar xvf linux-4.0.tar.xz - Let's prepare to compile the kernel, first with a
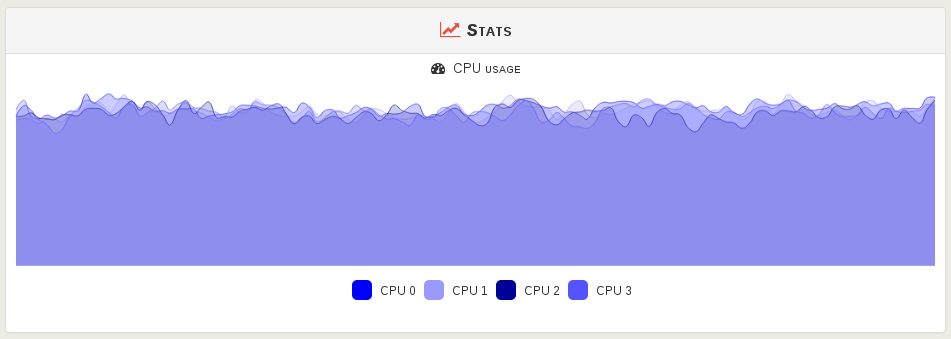
export CONCURRENCY_LEVEL=5to use the full power of 4 vCPUs. Then, fire the commandmake-kpkg --append-to-version "-customkernel" --revision "1" --initrd kernel_image kernel_headerswill make the CPU usage exploding! All the core are now working together to create Debian packages.
Let's zoom on the (intensive) CPU usage:
When it's all done, you can note the free RAM:
Windows 7 updates in a XenServer VM
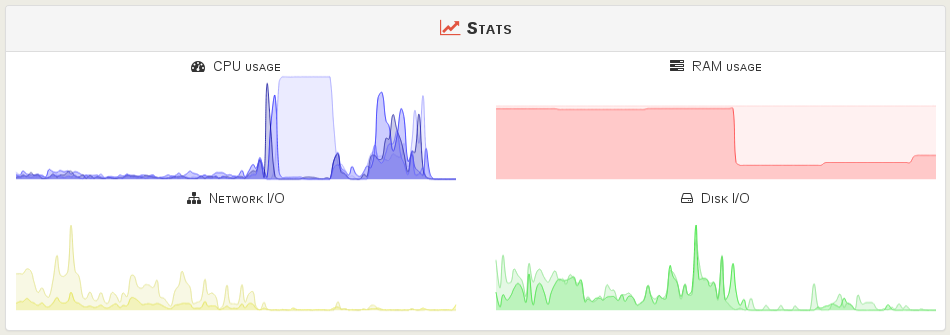
Well, we didn't use any Windows OS for production purpose, but we made some tests with it. Maybe you always wondered "what's going on when an update of Windows in running?". Let's see that:
- The CPU (blue) is the first to make a move, probably to check/analyse existing updates
- Then, the network (yellow) enters: updates are currently downloaded in the first place. You can also the RAM usage increasing (red) and the disk start to read data (green).
- And during a moment, just after the updates were downloaded, CPUs and disks are extensively used (you can see when 2 vCPUs are working together).
More!
Soon, we'll redo some benchmarks previously done for PV vs PVHVM, but this time with XenServer 6.5 and Xen Orchestra 3.9 to also display charts and verify the numbers.