XO Advanced Live Telemetry
When you are working on your virtualized infrastructure, you might need a very detailed view on what's going on. From resource consumption analysis (CPU/RAM) to network traffic, but also storage, having a kind of very detailed dashboard per host can be really useful.


When you are working on your virtualized infrastructure, you might need a very detailed view on what's going on. From resource consumption analysis (CPU/RAM) to network traffic, but also storage, having a kind of very detailed dashboard per host can be really useful.
Note: this feature will be only available in XCP-ng+XOA. If you are a hardcore Citrix Hypervisor user, let us know if you want this.
Today
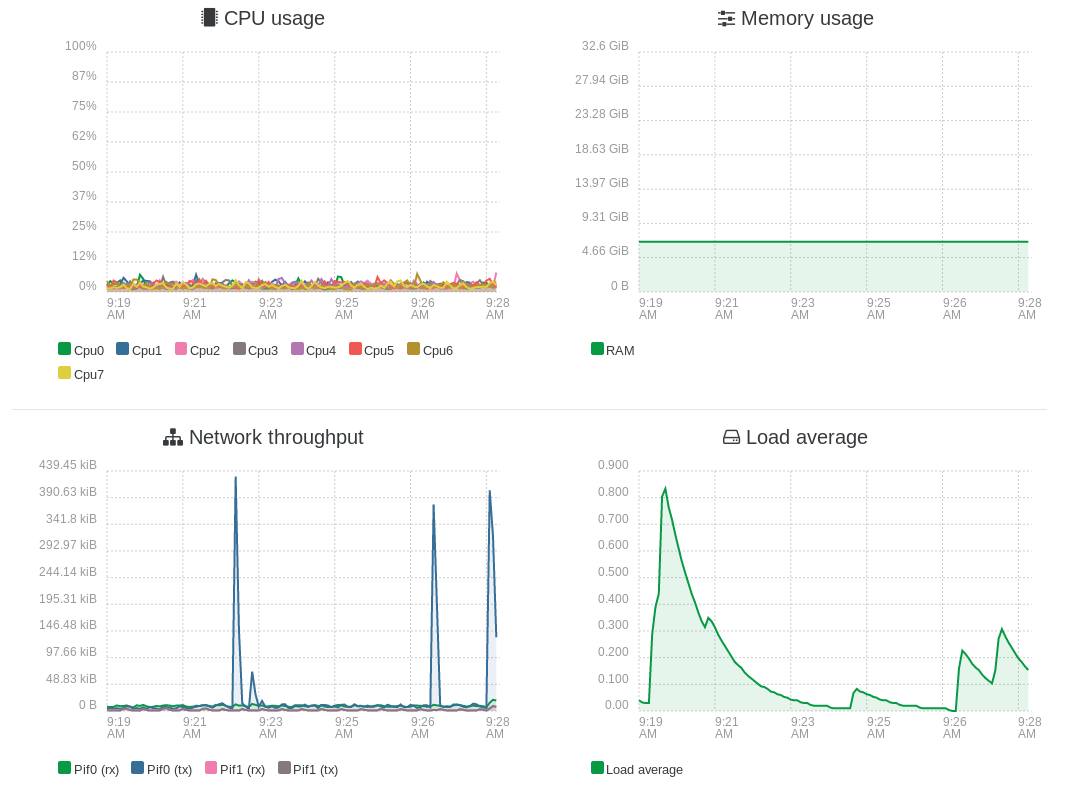
For now, Xen Orchestra is exposing host stats from XAPI (Citrix Hypervisor or XCP-ng API). Those stats are good, but very generic and only every 5 seconds for the last 10 minutes:
In some case, you may want to go deeper on various metrics, like:
- resource usage by program
- number of sockets opened
- CPU interrupts by device/call
- connection tracker, ie number of opened connections (firewall)
- packets errors
- IPMI info (temperatures, voltages, fans…)
And with a very thin tick (second) for the last hour.
Obviously, XAPI RRDs aren't fit for this. So enters "Advanced Live Telemetry".
Advanced Live Telemetry: design
Having those advanced metrics with this kind of specifications is not easy. We want:
- a nice dedicated web UI
- with a lot of live metrics (I mean, A LOT)
- not exposing a web UI on each host
- having only one entry point for all the hosts you monitor
- no hassle to configure this
Ideally, the solution should work on a push model. It means data is sent from the host to a "central" place. This way, adding host is easy without adding any extra configuration (eg: unlike Centreon or Nagios).
Also, streaming the data on a central place avoid to open any port on the host itself: this means no extra attack surface despite the new feature.
That's why we chose the following bricks:
- Our new XOA (Xen Orchestra virtual Appliance) embeds Netdata
- It's only accessible within Xen Orchestra itself, acting as a reverse proxy. A non-authenticated XO user won't be able to access it! Your advanced live telemetry is protected by design
- Hosts will only stream metrics toward XOA, which will act as a central Netdata host. No firewall port opened on the host
And all of this, with only a few steps, in fact, just clicking on that button in your host view:
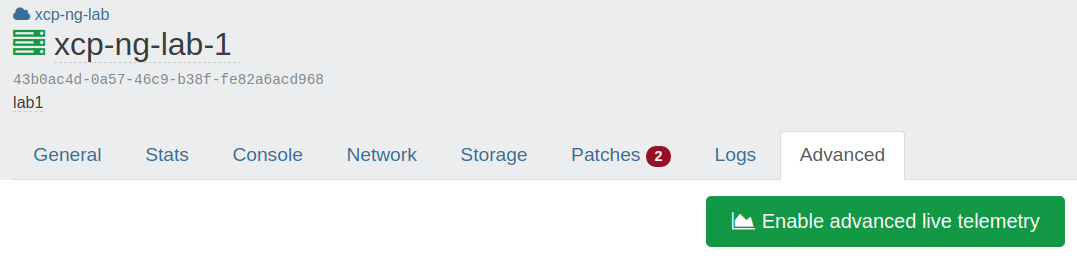
By clicking here, XOA will handle everything: installing netdata on the host, and configure a secured/encrypted streaming toward your XOA.
A great tool
This will be really helpful, for you but also for our own XOA and XCP-ng Pro Support: it means, in case of remote access, that we could access the live metrics of your XOA and your hosts, to be able to see what's going on in details. This will participate to an even better resolution time of potential problems.
This is also a way to find bottlenecks in various cases!
Screenshots
As soon it's installed, the button will now be replaced by a "Go to Advanced Live Telemetry". As soon you'll click on it, you'll be redirected to the netdata page of the host. If you have multiple host, you can access any of them directly from the top menu of the netdata UI.
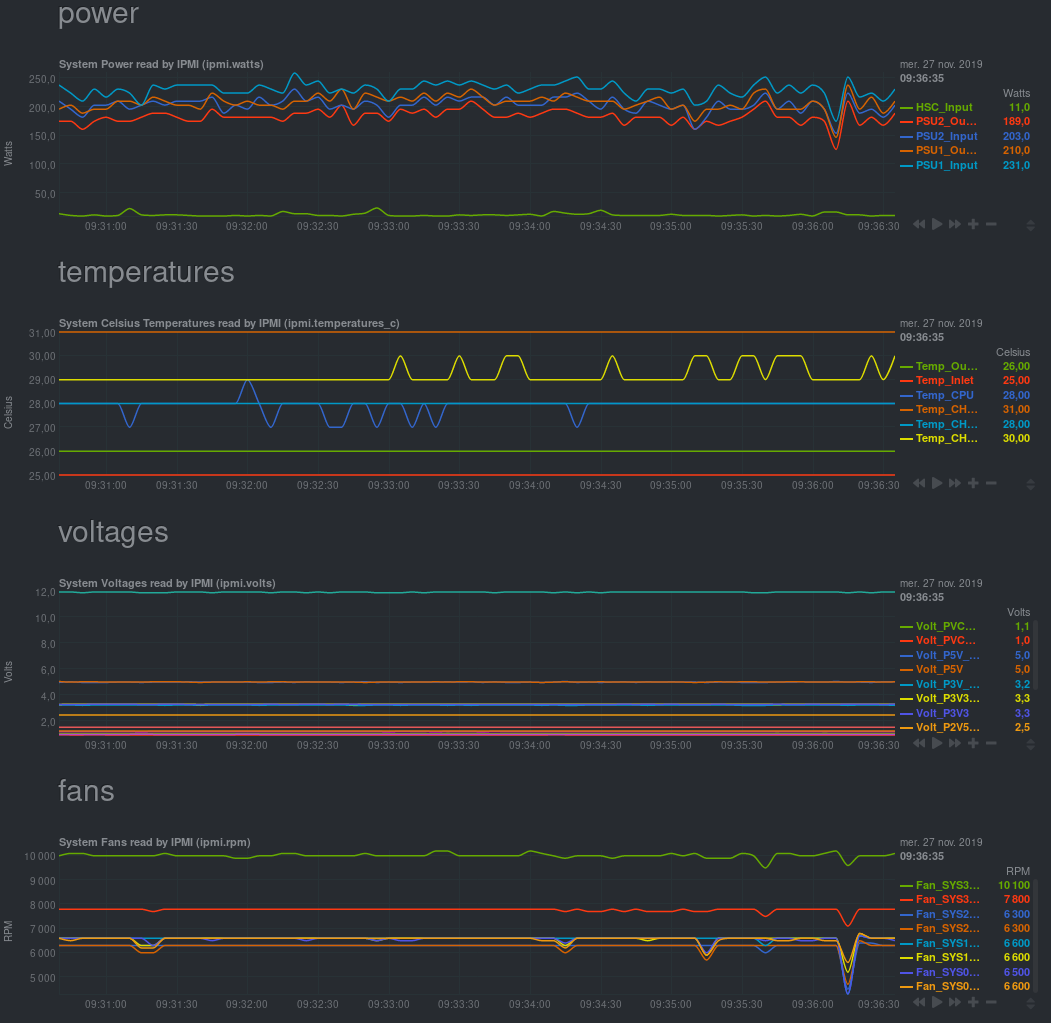
IMPI info (power, temperatures, voltages, fans…):
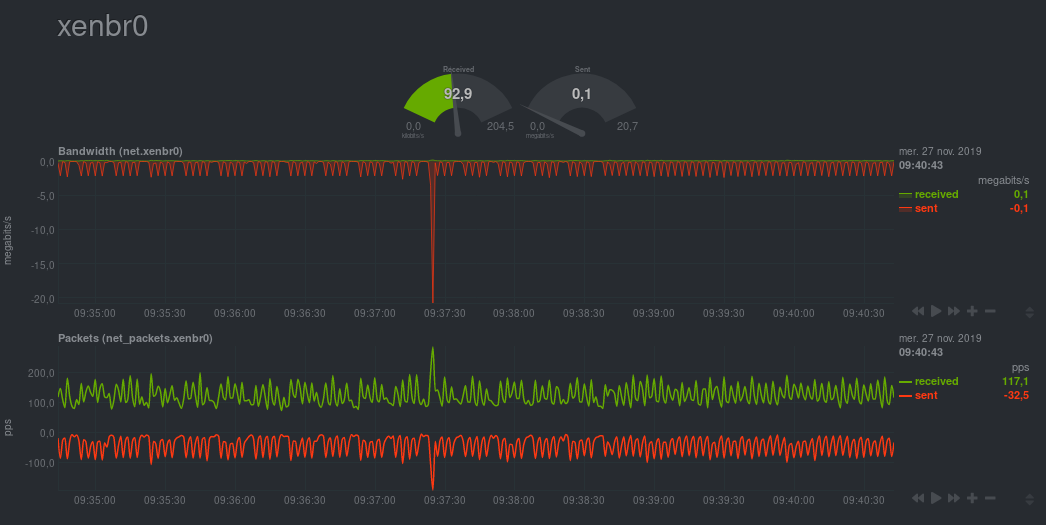
XCP-ng management network stats:
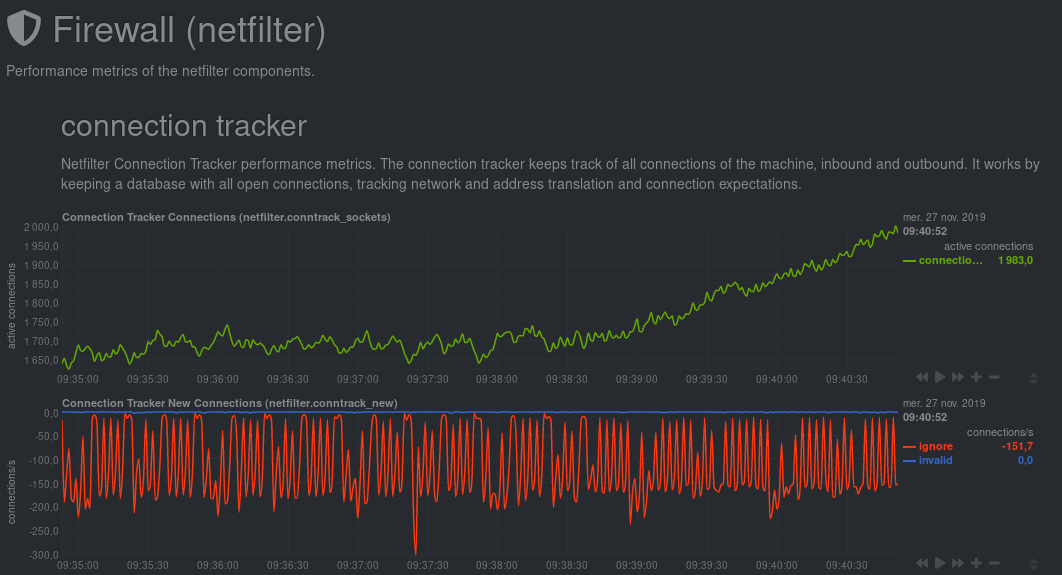
Firewall stats:
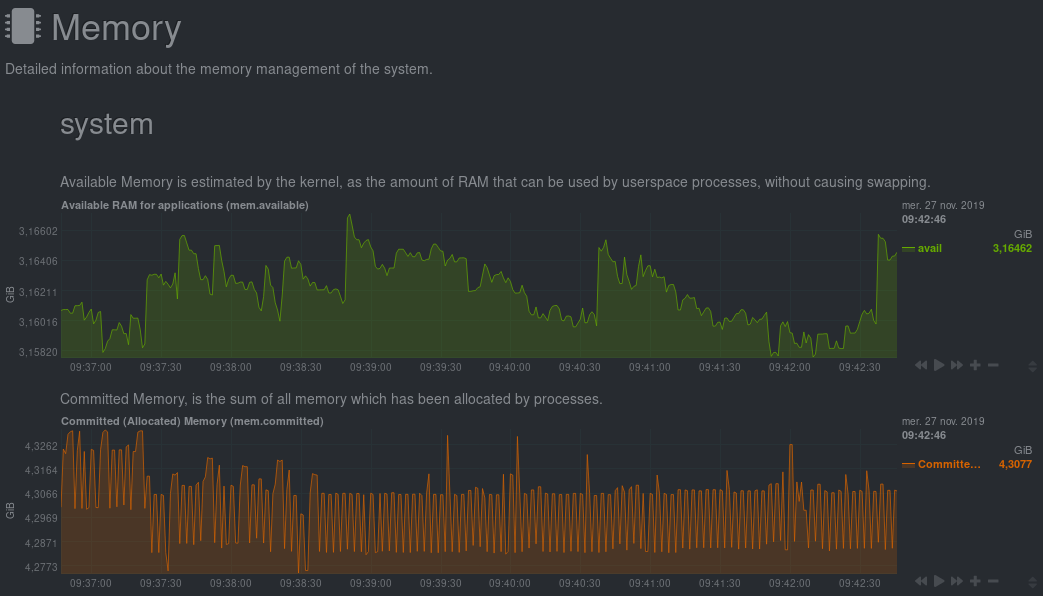
Memory stats: