Self Service dashboard

Coming for the Xen Orchestra next release (4.15), here is a dashboard dedicated to the resource usage of your configured self-service for XenServer. You can read a recap of the feature itself in our previous blog post: XenServer self service portal.
Let's see first the new shiny thing:
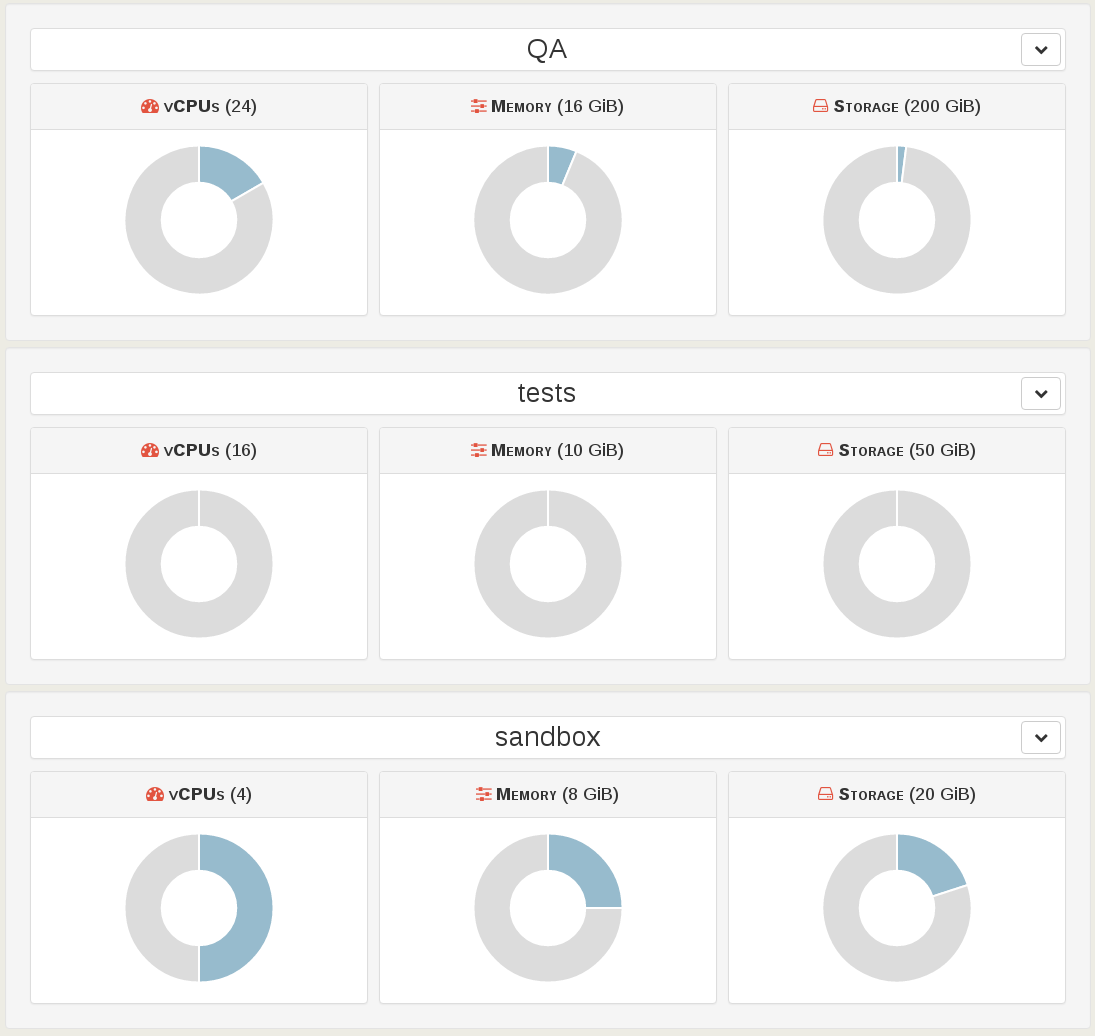
In this example, it means you have created 3 resource sets:
- QA, which is obviously used for creating VMs to test software installation/deployment.
- tests, which can be used for continuous integration (CI), VMs are generally created and destroyed quickly.
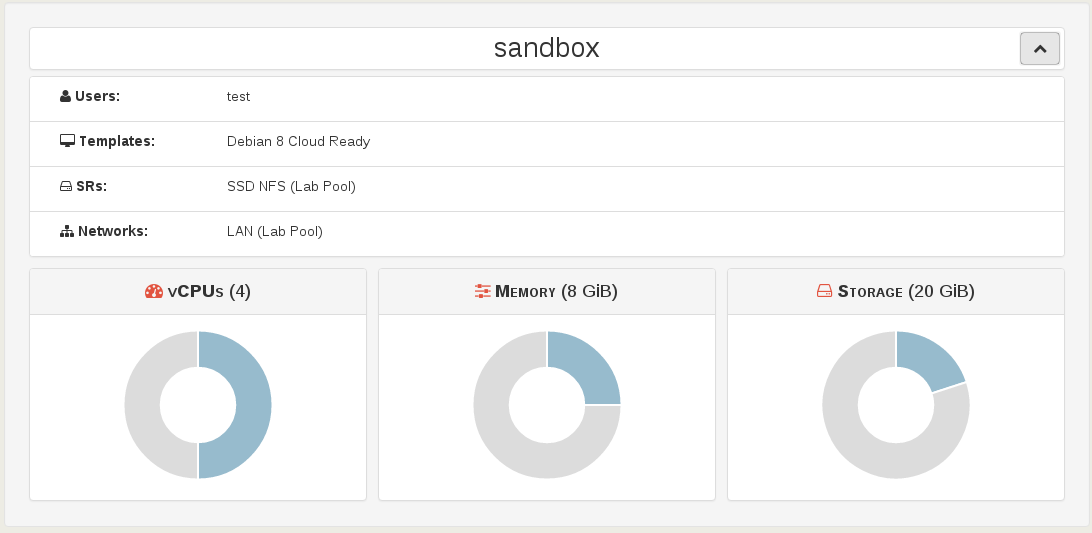
- sandbox is the place to make experiments for your dev team. Installing any OS they want and play with it.
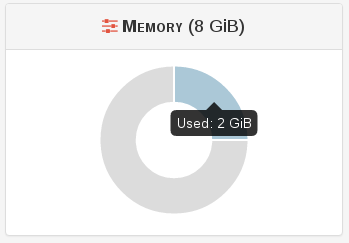
Also, hovering on a doughnut will give you the usage detail:
Finally, you can "expand" a resource set to display actual hosts/networks/SR behind it: