
XO live charts for host view
The next-release will offer a better visualization for the RAM occupied, and also the number of vCPUs used on the total number of CPUs.
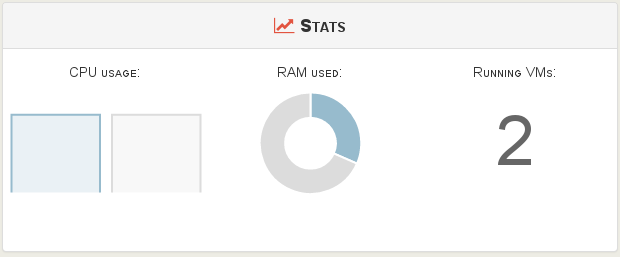
Those charts are animated on load:
But also they are changing in live, when your host memory or vCPUs usage is modified (in this example, during a live migration of a VM in this host):
Next step? Live metrics for all your VMs: CPU load, memory, network and disk usage with nice charts!