
Track your VMs properties

Coming (very soon) in the next release, a new dataviz. This one is based on "parallel coordinates" graph.
Para.. what?
Despite this is not the chart you'll see everyday, it's pretty common though. The idea is to visualize various data with various dimensions at the same time.
This great blog post explain the concept, and you can read the Wikipedia page if you want to know more.
Here is a short but clear example:

Each horizontal(-ish) line is a car model, with its own characteristics:
- Miles per Gallon (same concept as "liters per 100km", no comment about the US measurement system)
- Number of cylinders
- Horsepower
- Weight
- Year of release
Each vertical line is one of these characteristics. So you can find very quickly in this set the model which is not common and even find one fitting your needs.
Applied to VMs
Now, let's replace the cars with VMs. Each VM has its own characteristics:
- a number of vCPUs
- a RAM quantity
- a number of network interfaces (VIFs)
- a number of disks (VDIs)
- total disk space used (by all VM's VDIs)
With our small infrastructure you can see the result:
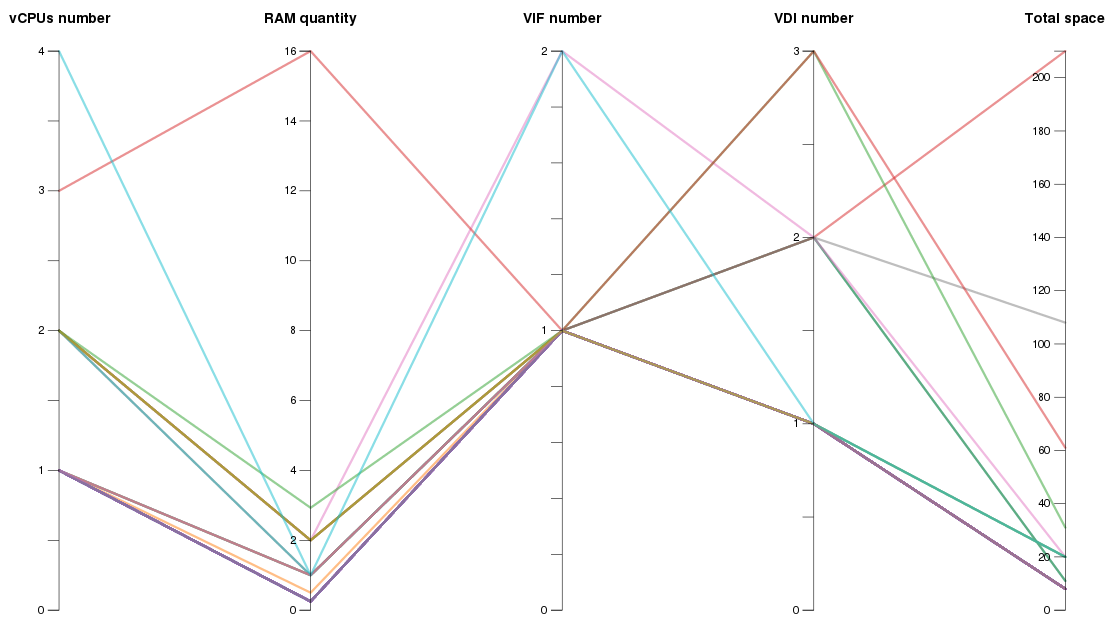
First thing you can see, there is one VM with a lot of RAM (16G).
Now, let's restrict some values in vertical axis like:
- VMs with 2 vCPUs
- and with 2GB of RAM
- only with one VIF
- VDI number and Total space doesn't matter
The result is pretty interesting: it will display only those matching the previous characteristics:
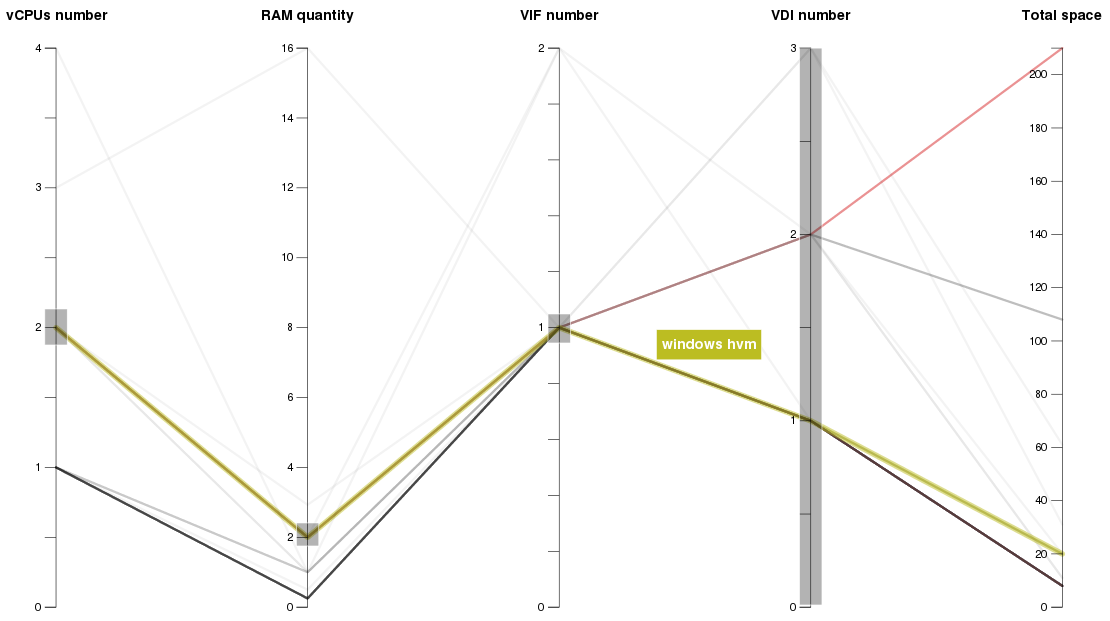
By hovering on one, I can see its name (windows hvm)
Want to see it in video? Go ahead:
This first implementation will be probably improved from your feedback. Stay tuned for the 4.5 ;)