
Statistics in XO

This coming feature in Xen Orchestra is really important. But not trivial to implement. Let's what it is all about.
Concepts
Our current architecture connects directly to the XAPI, listen to events and send orders. But statistics are not directly in the XAPI. It was the case in previous versions of XenServer (4 and before), but for performance reasons, it was placed in Round Robin Databases (RRD). Thus, you can call directly those metrics through the XAPI.
RRD and backend
Let's hear one of the main XAPI dev, Jon Ludlam:
RRDs are maintained for individual VMs (including dom0) and the host. Internally, the RRD is updated and maintained by a module similar to (but not actually) rrdtool. RRDs are resident on the host on which the VM is running, or the pool master when the VM is not running. For this reason, to obtain the data requires knowledge of where the VM is running.
You can read more about it here.
- After that, we need to make a HTTP request on the targeted object (on the right host) for extracting its metrics.
- Furthermore, we got an XML file we need to parse.
- Finally, passing those data from
xo-serverto any client requesting it.
And we're done for the backend.
GUI display
Wait a minute! Ok, we got data, but now we need to display what we want in the user interface. We already know we'll use that kind of graphs:
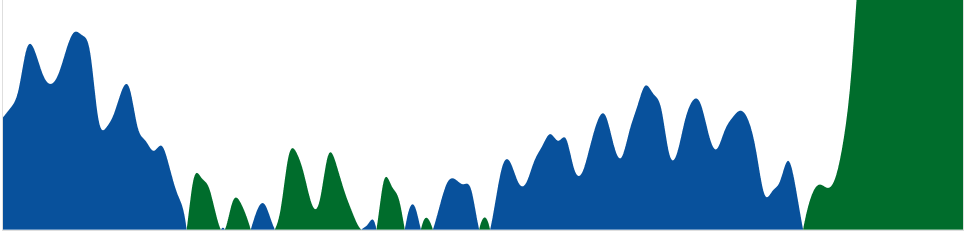
A first draft of where we'll put them:
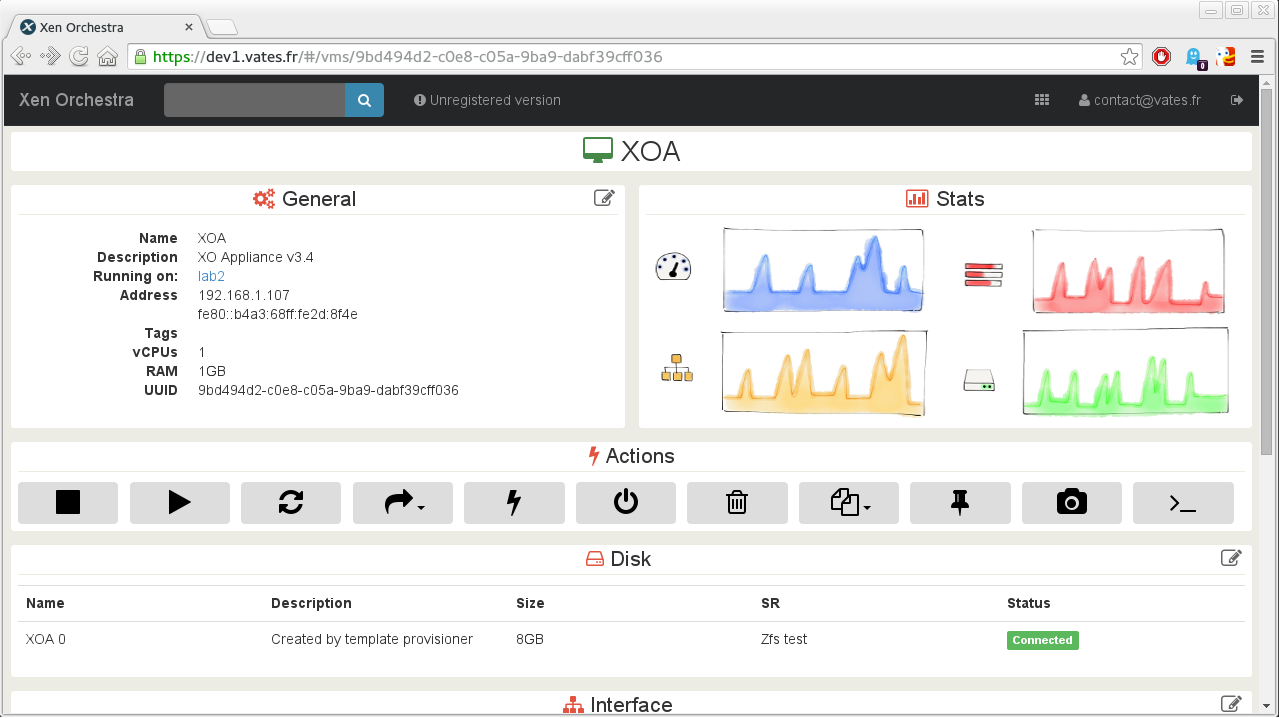
In this mock up, you'll have CPU, RAM, Network and Disk activity in the VM view. This not the final design, but it gaves a general idea. Thanks to our experience using a nice graph lib (d3js), we'll find the best way to show you what is really happening in your VM, host or any other object having metrics.
Conclusion
Implementing graphs and metrics in XO is not that complicated, but it requires some time to do it properly. We hope to manage this as soon as we got time to work on it. If you have any question or suggestion, do not hesitate to comment this post.