
Better XenServer graphs with Xen Orchestra

We are now one week after the release of Xen Orchestra 5.0, and we managed to made significant progress on resource reporting. This is a first glimpse of what's already done!
Parallel coordinates graph
Parallel coordinates is a common way of visualizing high-dimensional geometry and analyzing multivariate data. Wikipedia
This graph is now also available in 5.0, and it's very useful! We currently have 5 dimensions: vCPUs number, RAM quantity, VIF number, VDI number and total disk space.
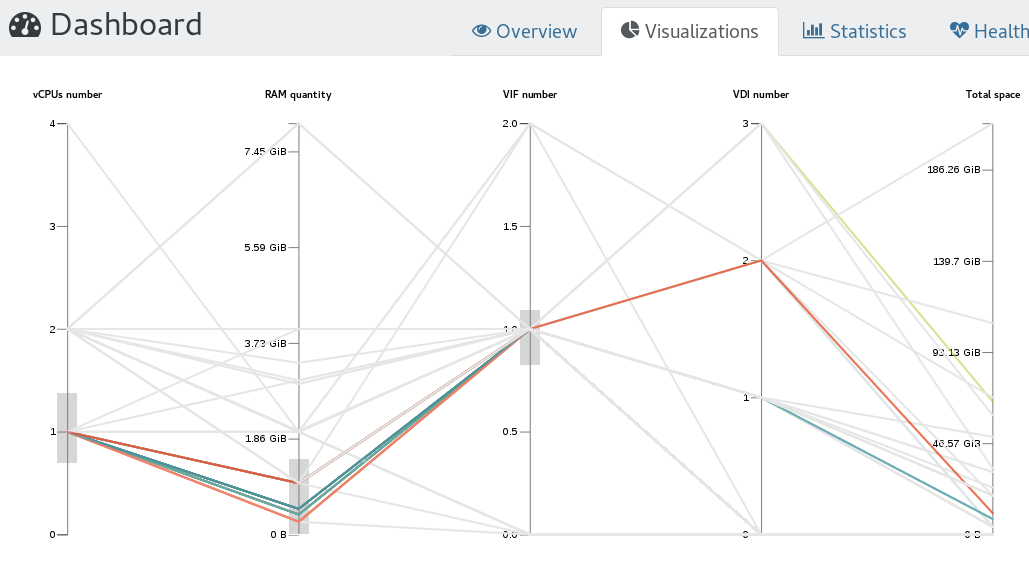
You can interact with the graph in various ways:
- hover on each line to discover the VM name
- select ranges to highlight automatically VMs in this range (eg VMs between 0 and 1,5 GiB of RAM used)
- combine this on multiple axis
It's really helpful to discrimated specific VMs or to understand your most common VM configuration.
Sum graph
Want to know the total disk writes of all VM your disks? Toggle the "sum" button in any stat view, and you'll see new lines. Example:
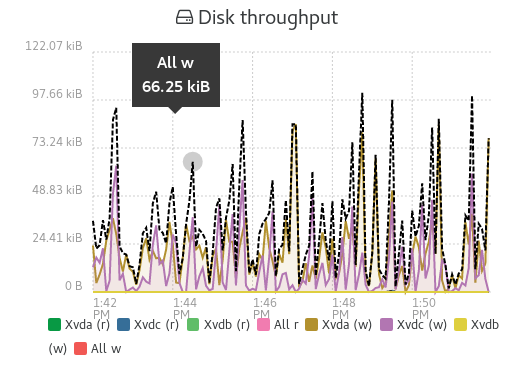
Sum of all writes for a VM on the dotted black line
Next?
Stay tuned, as usual, a lot of awesome stuff is on the way ;)